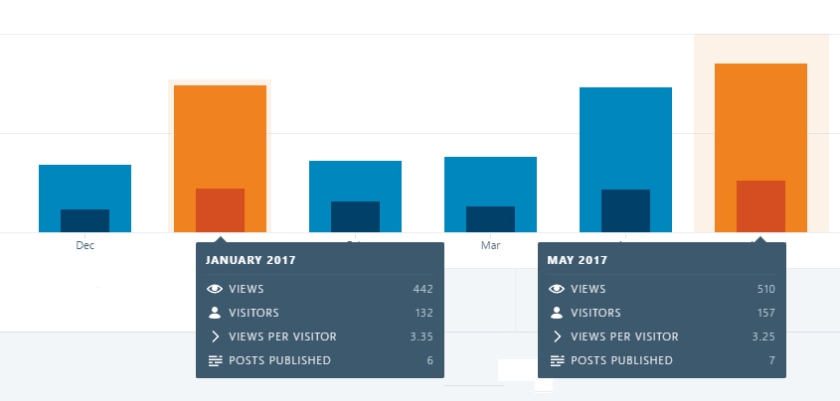
Thanks to all the visitors, readers, and commenters – May 2017 was the biggest month ever in the short history of the Lounge!
Thanks to all the visitors, readers, and commenters – May 2017 was the biggest month ever in the short history of the Lounge!

I hope even more people come to visit you in June :)
LikeLiked by 1 person
Thanks!
LikeLiked by 1 person
Nice one!
LikeLiked by 1 person
Thanks!
LikeLiked by 1 person
Congratulations. Hope your blog continues to grow.
LikeLiked by 1 person
Thanks!
LikeLike
Initial curiosity peak, and after that a steady upwards trend (with a negligible downwards movement of visitors from Feb to March). The numbers are looking good. Nice momentum.
LikeLiked by 1 person
February’s drop off is also probably related to my meltdown during the Winter season and skipping out on posting for most of the month… Lost a lot of trust (which I’m still earning back). In April and May, I’m back to regularly posting and into Spring. At least that’s how I see the data.
But yeah, there’s still upward momentum and that’s a Good Thing.
LikeLike
It’s good to see what you can do, but I wouldn’t over-interpret data. For example, while visitors are slightly down, views are slightly up. One possible reason for this could be that – for some – reason people were checking in with less devices (I assume “visitor” is really “unique IP-address” or something similar; if that’s the case, I account for two visitors. A person can account for many visitors: desktop (work & home), tablet, phone…).
If you’re right, and you did lose some trust in February, then you’d have to explain how this translates to more views. One possibility I could see is that the folk who did remain checked in more often to see if there any updates. (Is this plausible, with twitter being available? I genuinely can’t judge that.)
Would also be interesting to compare numbers with other blogs. Sometimes, what looks like a personal trend is part of a wider trend. Sorry, if I’m rambling; it’s my background in sociology coming to the fore. But with numbers such as these, it’s the trends that are more reliable. Outliers can have any number of reasons or none.
LikeLiked by 1 person
You’re right, I shouldn’t overthink this stuff. :) I’m just happy people are looking and commenting!
LikeLike